


Flood map of l'Horta Sud
It will help improve models that predict how water moves during floods and propose more efficient and safer solutions for similar events.
[ 29/01/2025 ]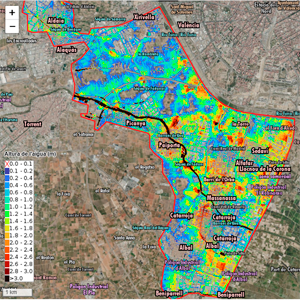
A team of researchers from the Universitat Politècnica de València (UPV), belonging to the Geoenvironmental Cartography and Remote Sensing Group (CGAT) of the Cartographic Engineering, Geodesy and Photogrammetry Department (DICGF), together with the School od Geodetic, Cartographic and Topographic Engineering, (ETSIGCyT), has developed a street-by-street flood map for the municipalities of l’Horta Sud following the DANA (isolated high-altitude depression) event on October 29.
This work aims to provide useful information for the affected populations, better understand the nature of the event, and offer a key tool for managing future floods. Students from the ETSI Geodesy, Cartography and Topography of the UPV also contributed to its project.
" The work is based on field measurements taken between November, December 2024, and January 2025. We are presenting a preliminary result; we are still working to complete the mapping of all flooded areas," explains Josep E. Pardo, from the Geoenvironmental Cartography and Remote Sensing Group at the UPV.
The UPV team carried out this study in three phases: the first involved field surveys; the second focused on generating water sheet models and maximum flood depths; and finally, they developed an interactive viewer where the street-by-street flood map can be consulted.
Field survey and Water Sheet Height
In the first phase of the project, a total of 5,097 points were recorded throughout the affected area. "To do this, we used a topographic levelling rod placed against the wall where the watermark was located and measured the depth reached by the water at that point," explains Pardo.
To determine locations, they used the GNSS (GPS) sensor of mobile devices, the Open Street Maps (OSM) cartographic base, and orthophotos from the Institut Cartogràfic Valencià (ICV). In the second phase, the UPV team generated models of the water sheet and maximum flood depths. This data makes it possible to determine how high the water reached.
Development of the Interactive Viewer
The final result of the work carried out by the UPV team is an interactive viewer that is accessible to anyone and allows users to visualize the maximum depth reached at each point in the municipalities of l’Horta Sud.
"The viewer includes an active layer that allows users to recognize the nomenclature, the ICV orthophoto taken before the flood (2024), and street data from Open Street Maps. The depth information is represented by various colors: cooler tones indicate shallower depths, while warmer tones indicate greater depths. Clicking on a coloured area provides the maximum depth the water reaches that location," explains Pardo.
The UPV researcher adds that the flood depth map aims to document how the flood actually occurred and can serve as a reference against theoretical modelling. "Our work will help improve models that predict how water actually moves during floods, which will be useful for proposing more efficient and safer solutions for future flood events," concludes Josep E. Pardo.
This information can be accessed at the following link: https://dana2024.upvusig.car.upv.es.
Outstanding news
 The Diamond Army
Two students came up with the UPV initiative that has engaged more than 1,600 volunteers and shattered the false myth of the 'crystal generation'
 ARWU 2024
The Shanghai ranking reaffirms the UPV as the best polytechnic in Spain for yet another year
 Distinction of the Generalitat for Scientific Merit
Guanter has been distinguished in recognition of his research excellence in the development of satellite methods for environmental applications
 The new statutes come into force
The Universitat Politècnica de València is the first university in Spain with statutes adapted to the new LOSU
 NanoNIR project against breast cancer
UPV Researcher Carla Arnau del Valle receives an EU Marie Curie grant to develop biosensors for the early detection of this cancer
 Large artificial intelligence language models, increasingly unreliable
According to a study by the Universitat Politècnica de València, ValgrAI and the University of Cambridge, published in the journal Nature